Analytics module

The SENAR web Analytics dashboard provides clear insight into identifying profiles and patterns within a group of users. This is particularly helpful when assessing a workforce and making sure the training programs in place are efficient enough to achieve the required levels of performance.
To access our analytics module, head to SENAR Studio and sign in with the same credentials you've used in the SENAR app.
Dashboard Features
- Use the filters at the top of the dashboard to display the data you are interested in.
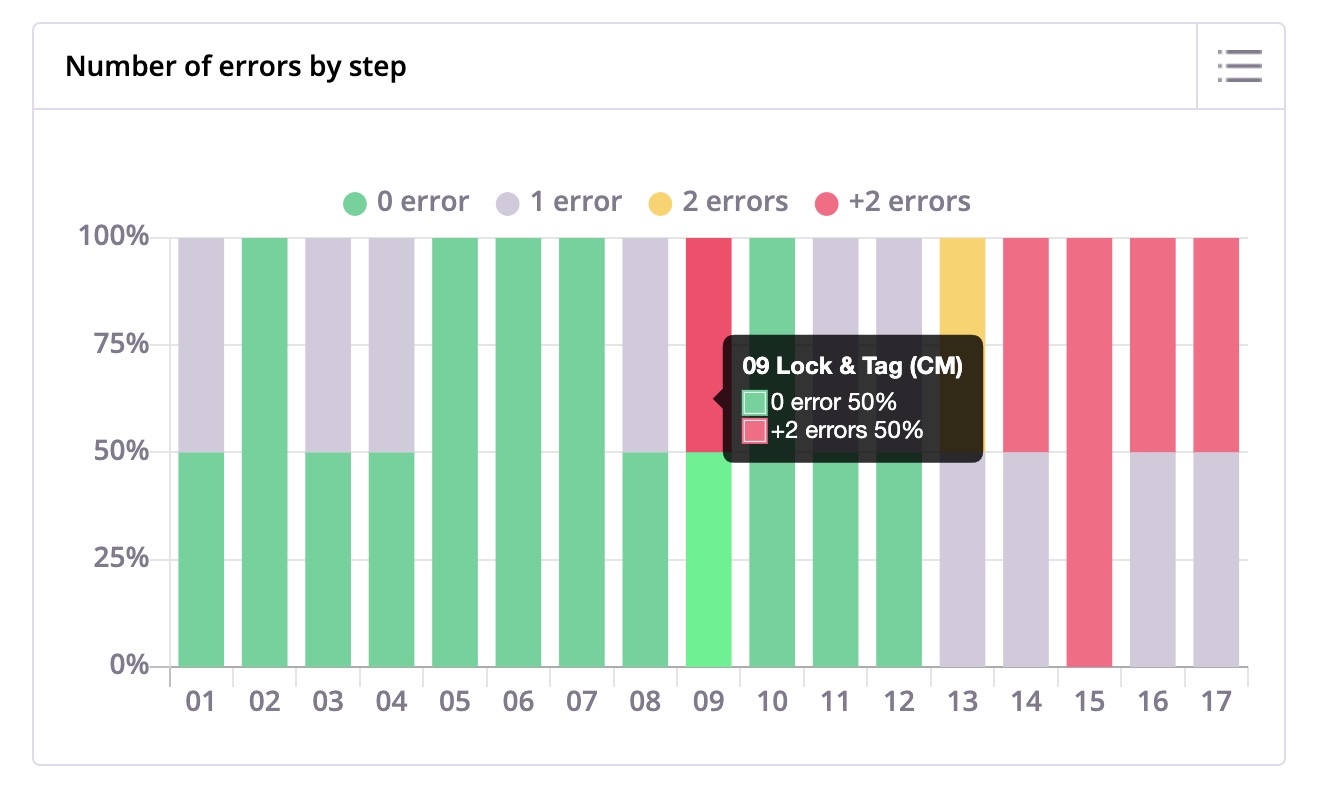
- Roll over a data set to get more details about it. For example, rolling over a step number on the x-axis will display the name of that step.
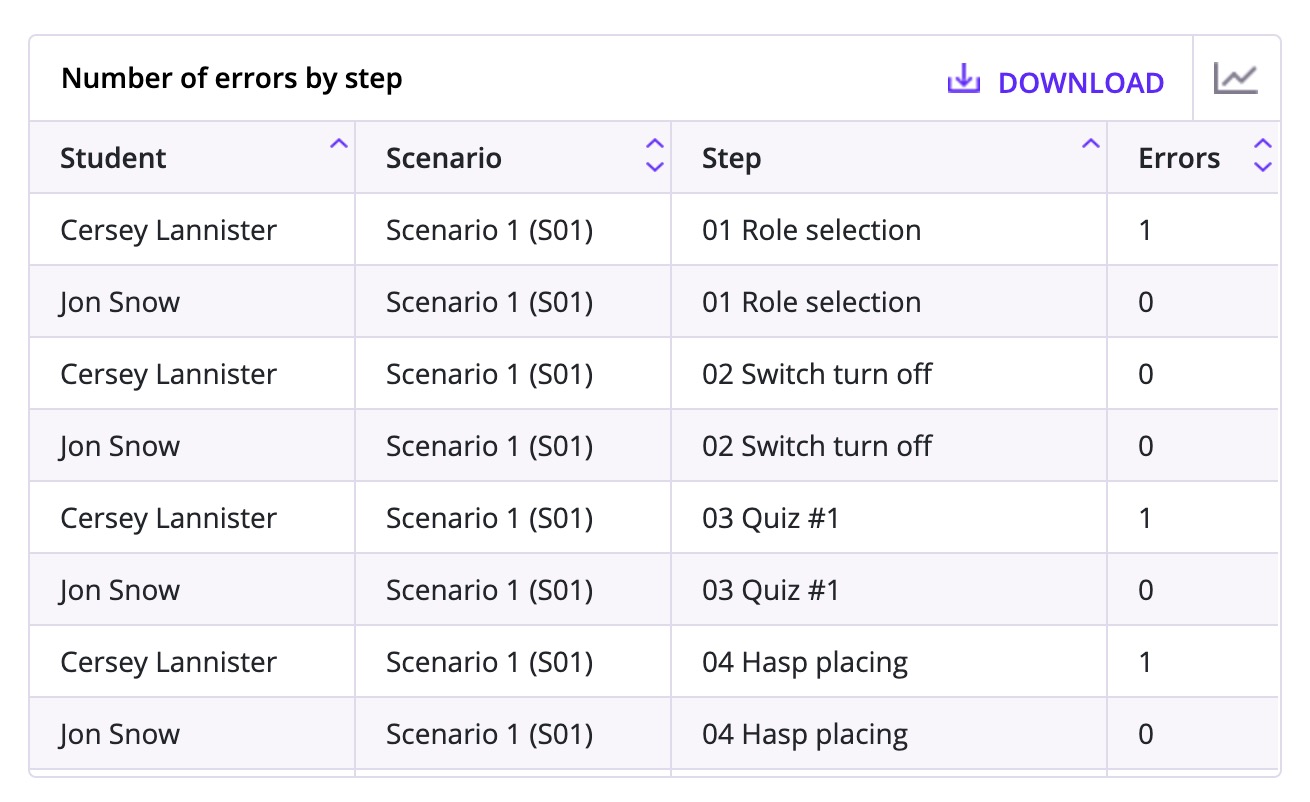
- To switch between chart and table view, click the icon at the top right corner of a container.
- In chart view, you can temporarily exclude a data set simply by clicking on its label in the legend (it will then be crossed out).
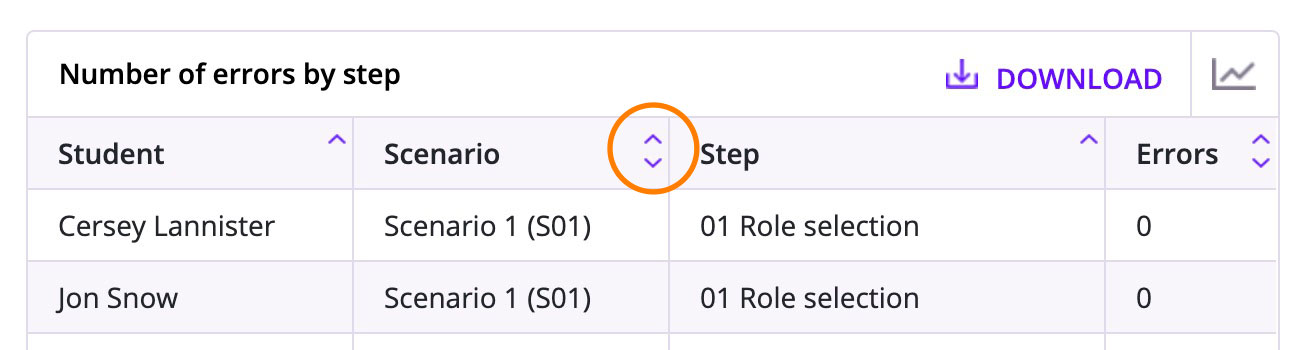
- In table view, you can sort data by clicking the column labels.
- The Try filter shows student progress as they practice. Three tries are displayed: the 1st one, the 2nd one and the last one. If students have run a scenario only once, their first and last tries are the same.
- Data export:
- To export table data, click the blue link next to the switch button.
- To export all of the data from a scenario data, click the CSV Export button at the bottom right corner of the dashboard.
To learn more about the analytics export, please consult this article.
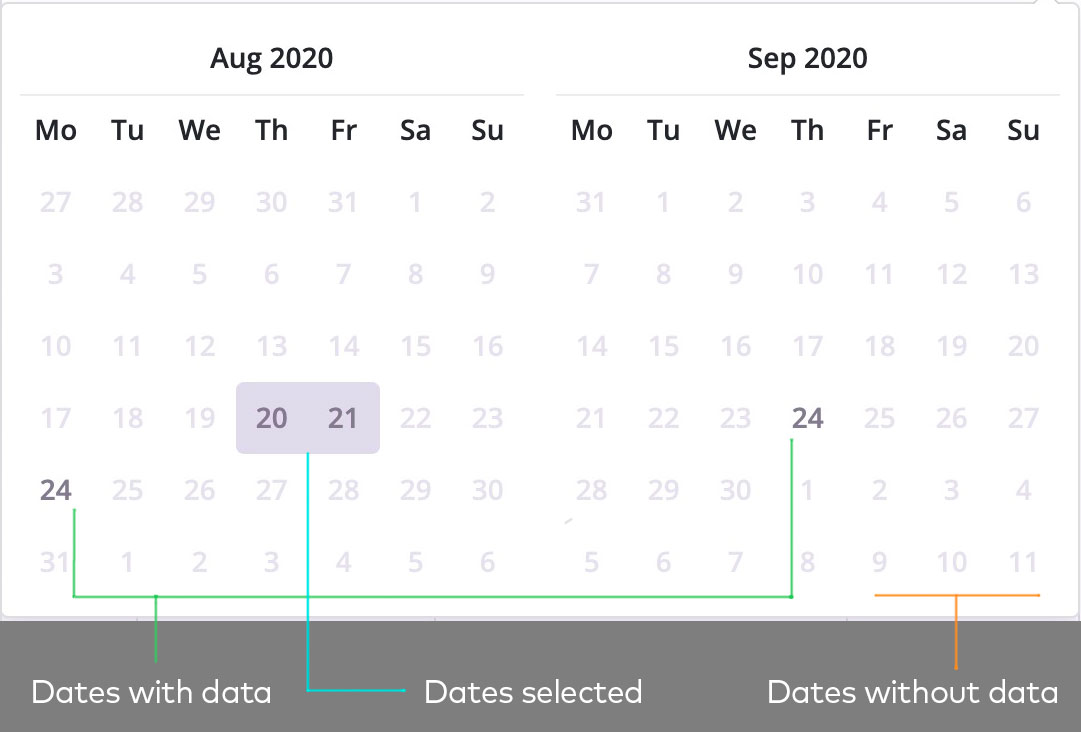
About the calendar
- After selecting an instructor and a simulator, the most recently recorded data for this set is automatically displayed. If the dashboard looks empty at first glance, check the Dropout report at the very bottom of the page.
- You can only select a range from 1 to 7 days.
- The disabled dates (in light gray) have no recorded data.
About the Dropout report
When students do not complete a scenario (ie. they miss the End of Mission popup or the Accident popup), it is considered a dropout. This graph shows the step at which users have dropped out.
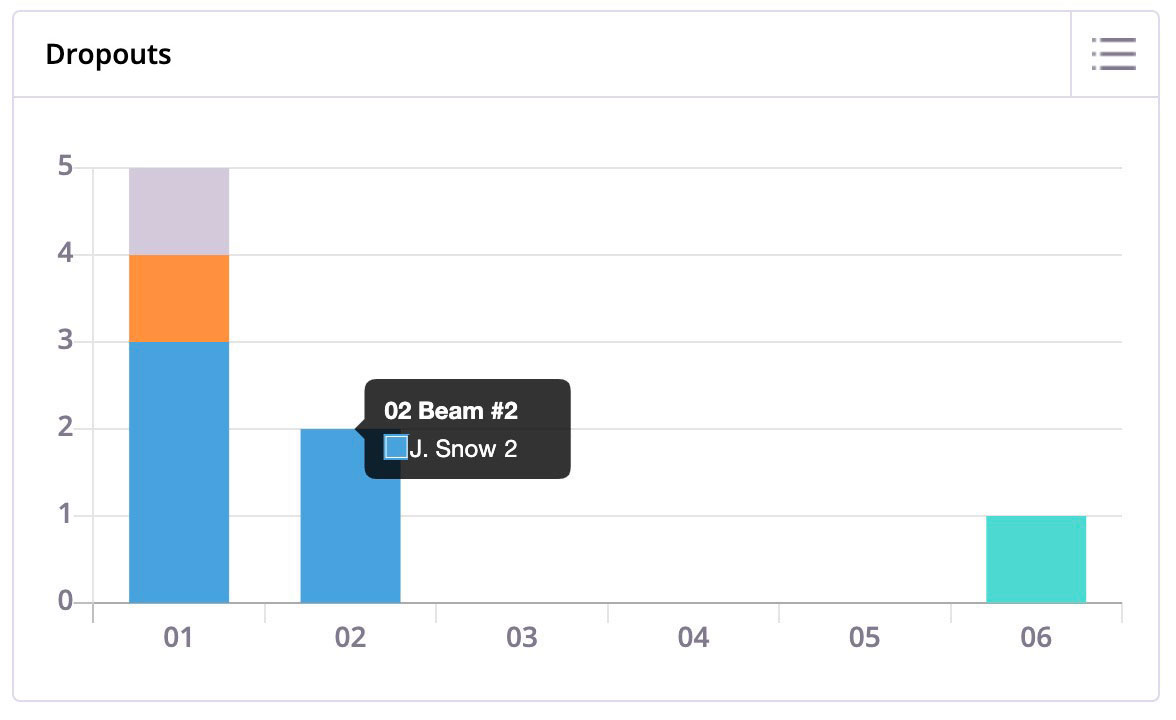
This report is the only one that is not impacted by the Try filter.